QR_HOBO_CODES in Le Temps
22 August 2011 / announcement, pressCaroline Stevan has written a nice review (“Bons plans urbains en forme de codeQR“) of the QR_HOBO_CODES and QR_STENCILER in Le Temps, a major French-language newspaper.

Caroline Stevan has written a nice review (“Bons plans urbains en forme de codeQR“) of the QR_HOBO_CODES and QR_STENCILER in Le Temps, a major French-language newspaper.
NOTE: This page is an archival copy. The ‘official’ web page for this project is:
http://fffff.at/qr-stenciler-and-qr-hobo-codes/.
Yep, it’s a QR code stencil generator! In cooperation with the F.A.T. Lab and my student Asa Foster III, I am pleased to present QR_STENCILER, a free, fully-automated utility which converts QR codes into vector-based stencil patterns suitable for laser-cutting. Additionally, we present QR_HOBO_CODES, a series of one hundred QR stencil designs which, covertly marked in urban spaces, may be used to warn people about danger or clue them into good situations. The QR_STENCILER and the QR_HOBO_CODES join the Adjustable Pie Chart Stencil in our suite of homebrew "infoviz graffiti" tools for locative and situated information display.

CONTENTS
ABOUT THIS PROJECT
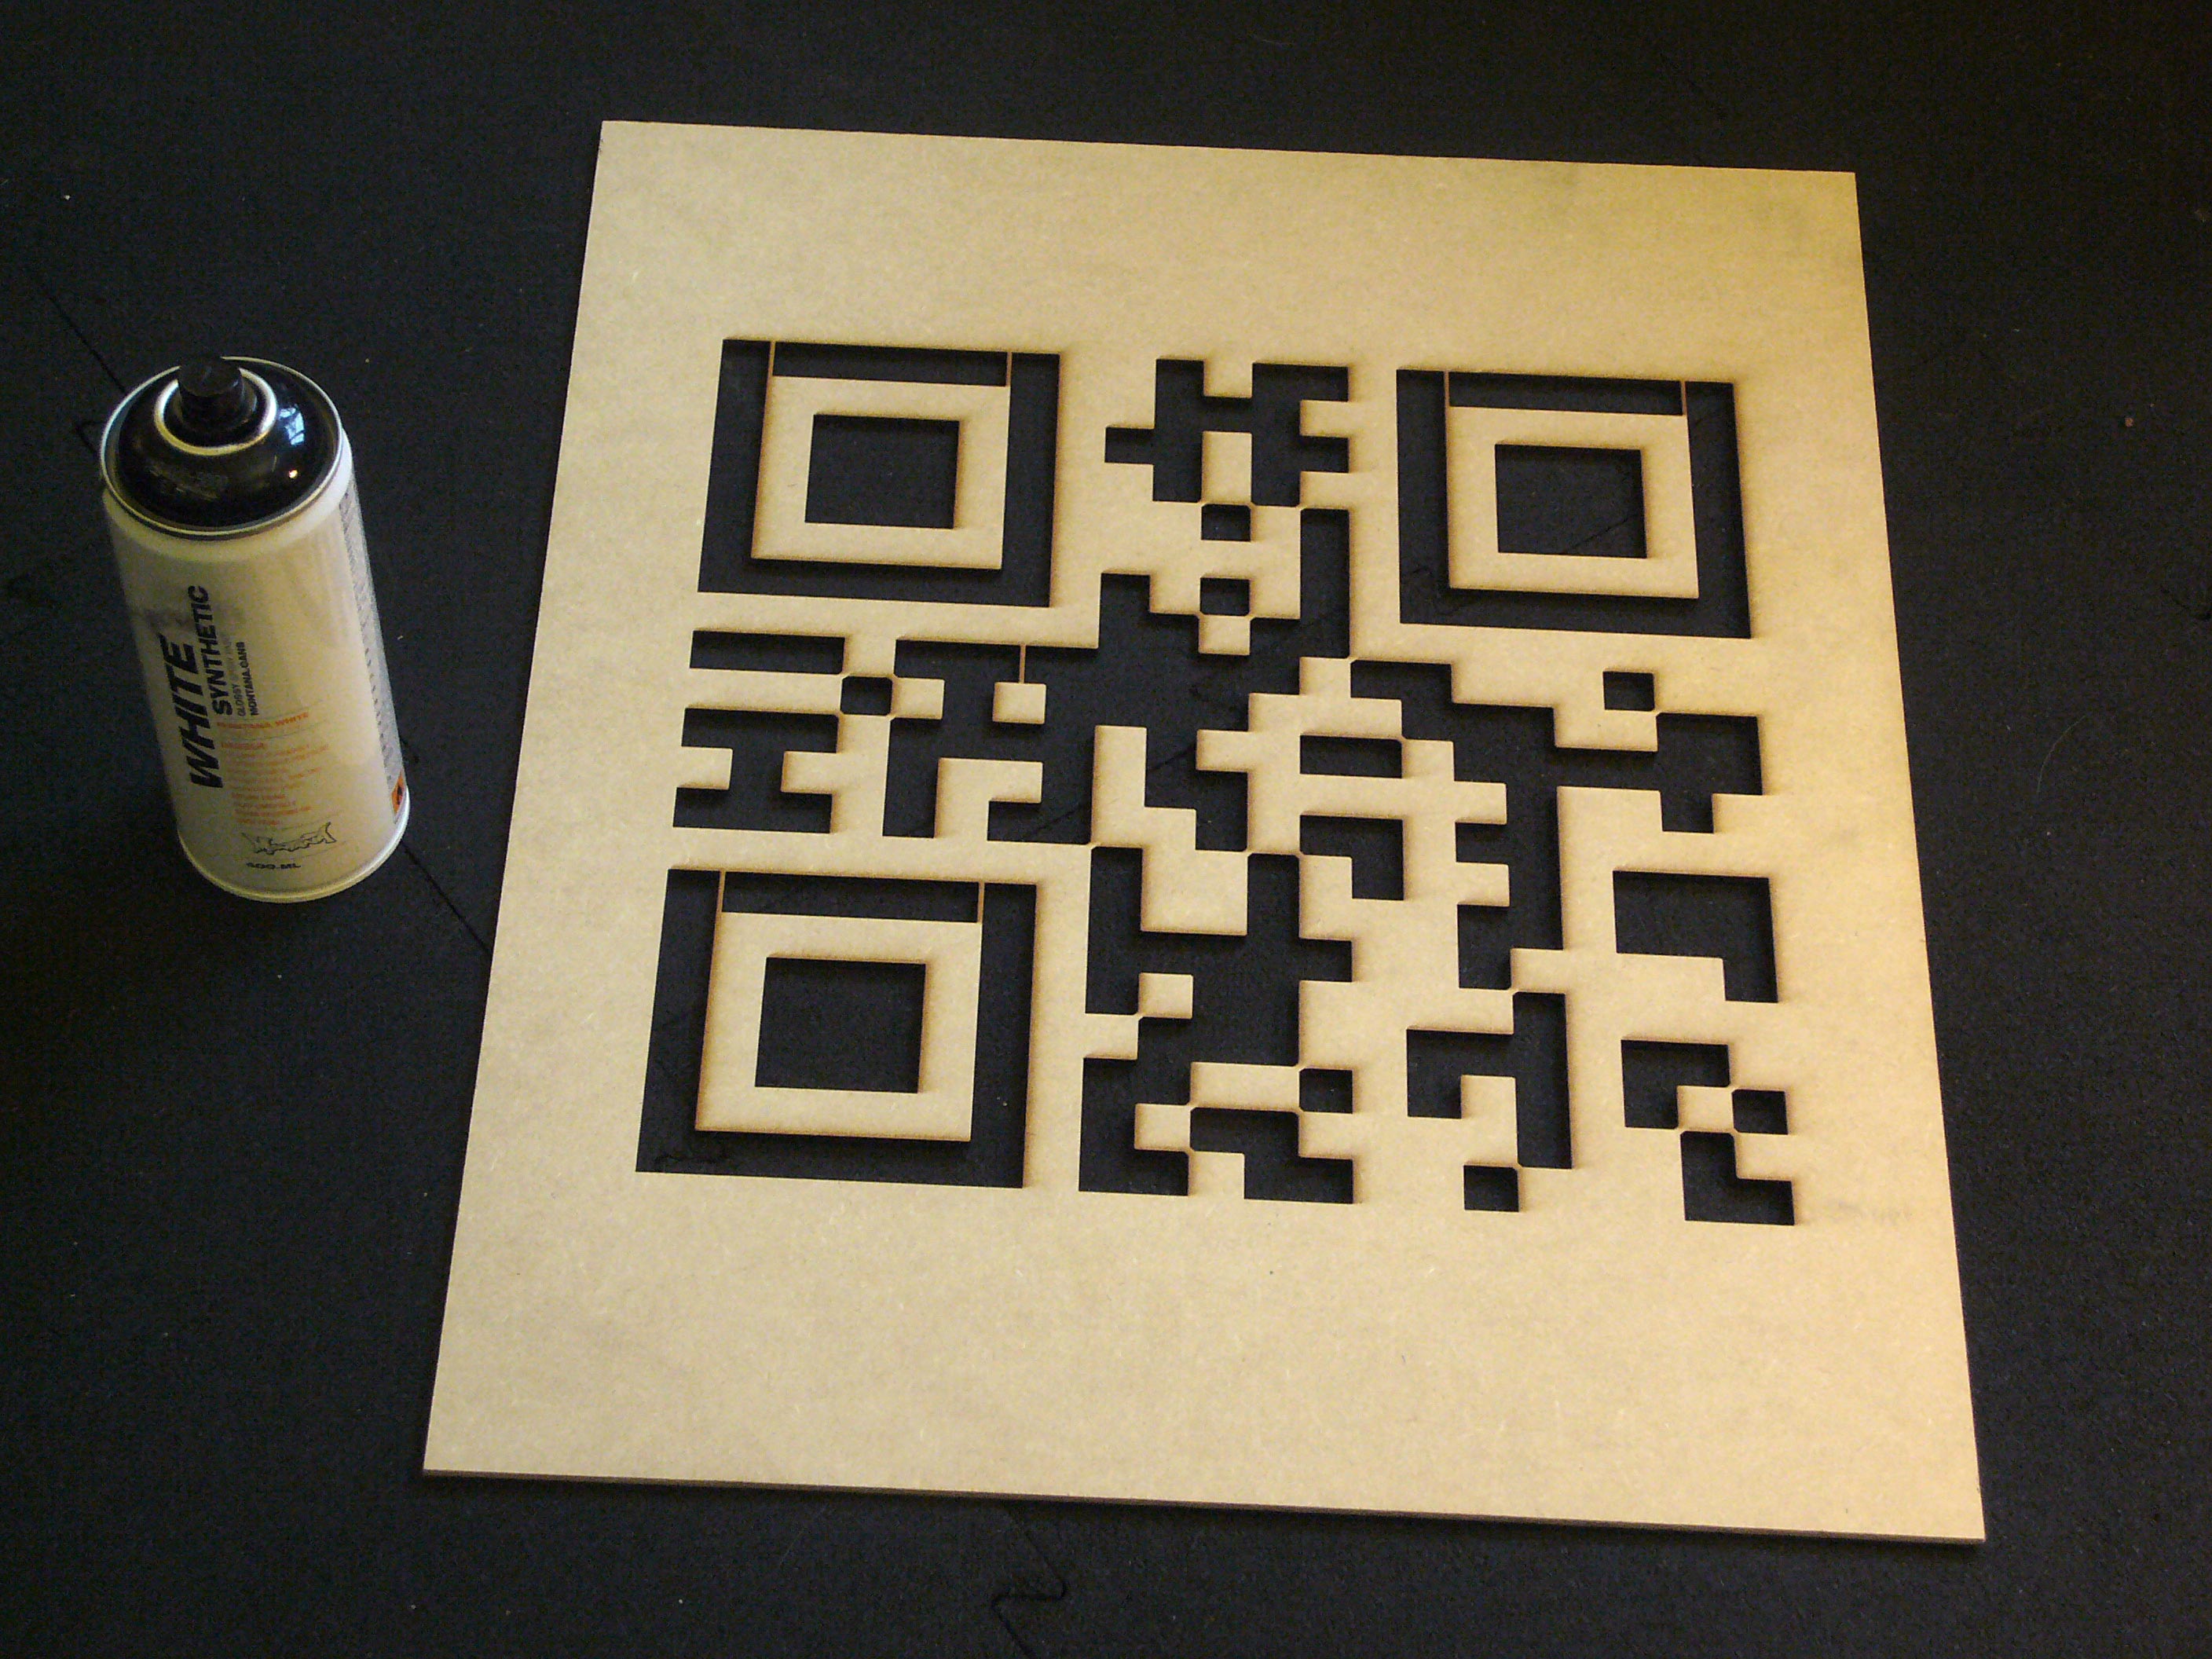
QR codes are a form of two-dimensional barcode which are widely used to convey URLs and other short texts through camera-based smartphones. A variety of free tools exist to generate QR codes (such as the Google Charts API) and to read them (such as TapMedia’s free QR Reader for iPhone app). Our QR_STENCILER is a Java-based software utility which loads a user-specified QR code image — from which it then generates a lasercutter-ready, topologically correct stencil .PDF. As Fred Trotter has pointed out, QR codes contain stencil islands in unpredictable configurations. QR_STENCILER automatically detects and bridges these islands, using thin lines that are minimally disruptive to the highly robust QR algorithm. It does so through the use of two basic image processing techniques: connected component labeling (sometimes called blob detection) and 8-connected chain coding (sometimes called contour tracing). QR_STENCILER was created with Processing, a free, cross-platform programming toolkit for the arts.

Closeup of a QR code lasercut in 1/8"-thick fiberboard. The QR_STENCILER automatically thickens corners between squares (left) and generates "bridges" to connect stencil islands (center). The level (amount) of island bridging is user-adjustable.
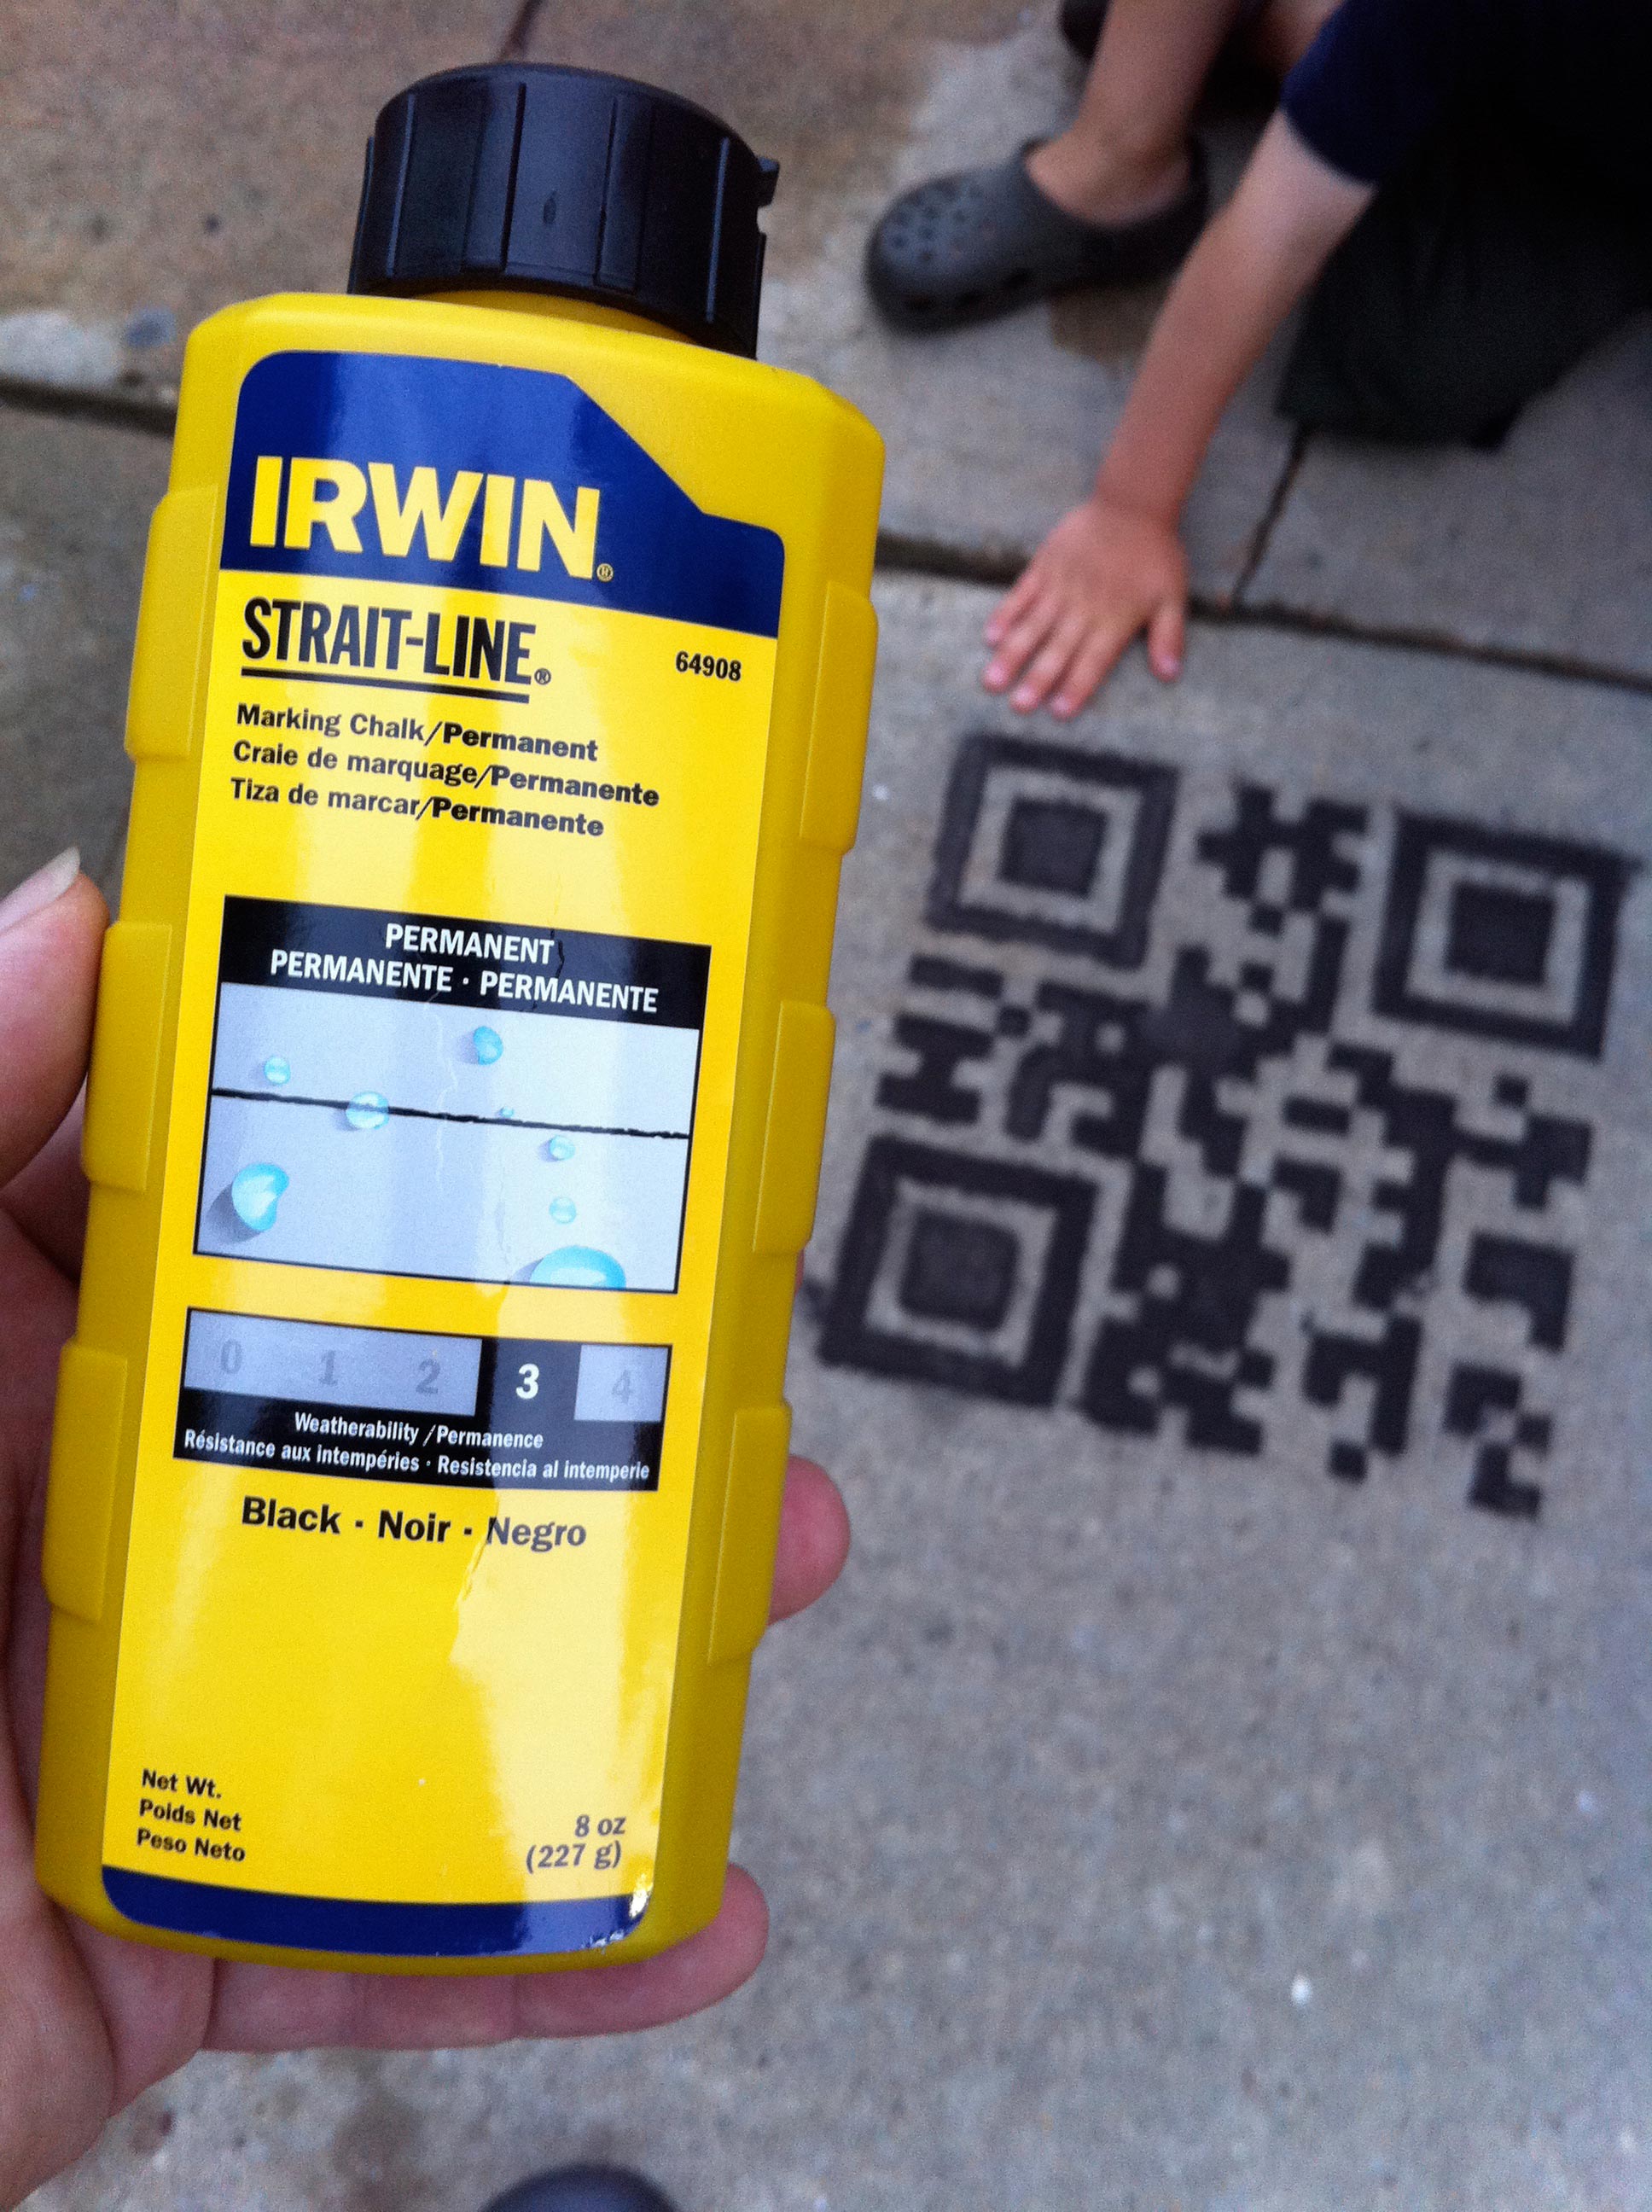
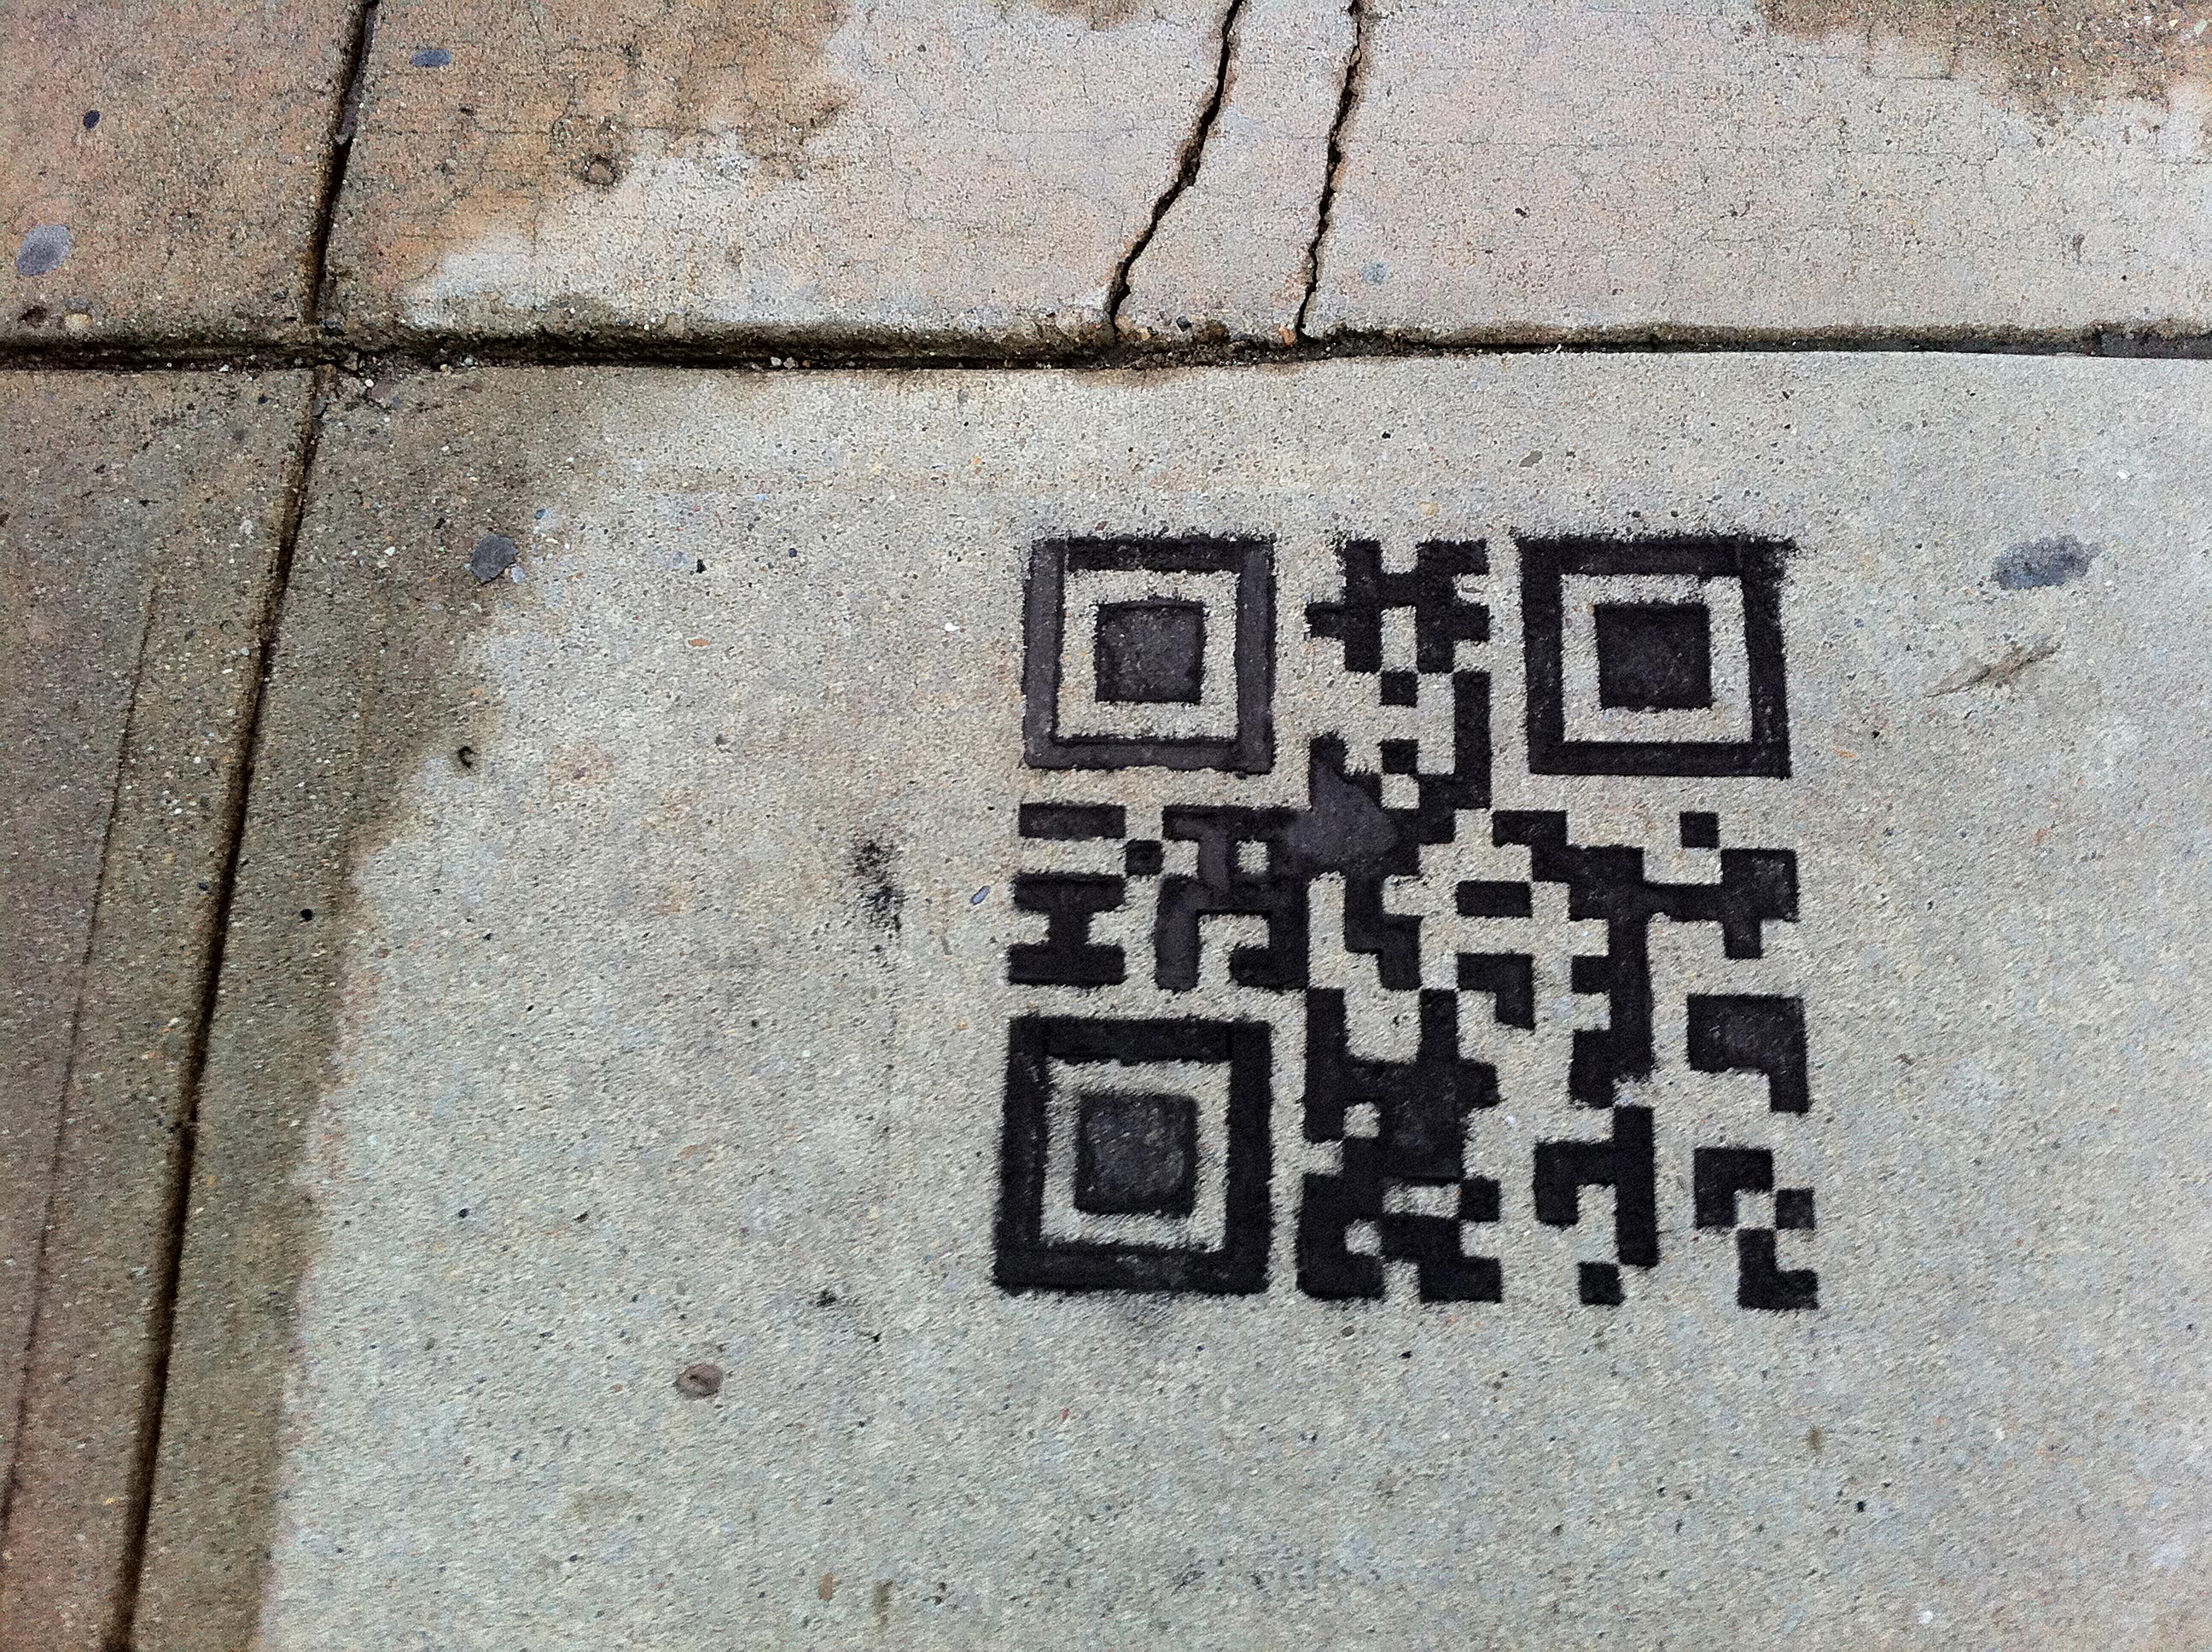
Accompanying the QR_STENCILER are the QR_HOBO_CODES (see below), a set of 100 lasercutter-ready QR stencil designs created with the QR_STENCILER software. These stencils can be understood as a covert markup scheme for urban spaces — providing directions, information, and warnings to digital nomads and other indigenterati. We present these as modern equivalents of the chalk-based "hobo signs" developed by 19th century vagabonds and migratory workers to cope with the difficulty of nomadic life. Indeed, our set of QR stencils port a number of classic hobo annotations to the QR format ("turn right here", "dangerous dog", "food for work") as well as some new ones, with a nod to warchalking, that are specific to contemporary conditions ("insecure wifi", "hidden cameras", "vegans beware").

Examples of 19th- and 20th-Century "hobo signs". Sources: Fran DeLorenzo (left), Wikipedia (right).
DOWNLOAD & INSTRUCTIONS
QR_STENCILER has been tested in MacOSX 10.6.8, but (since Processing is a cross-platform toolkit) it should work in Windows or Linux as well.
LICENSE
The QR_STENCILER software is provided "as is", without warranty of any kind. QR_STENCILER is licensed under a Creative Commons Attribution-NonCommercial-ShareAlike 3.0 Unported License. You are free to distribute, remix, and modify QR_STENCILER, so long as you share alike and provide attribution to FFFFF.AT. The repackaging of QR_STENCILER as or into commercial software, is expressly prohibited. Please note that QR_STENCILER also enjoys protections under the GRL Repercussions 3.0 license. More details about QR_STENCILER’s license and warranty can be found in the preamble to its main code file, QR_STENCILER.pde; for other uses, please contact us. The 100 QR_HOBO_CODES and their respective stencils are hereby dedicated to the public domain.
 25-minute wait png | stencil |
 assholes png | stencil |
 bad coffee png | stencil |
 bad food png | stencil |
 bad tempered owner png | stencil |
 bad water png | stencil |
 be alert png | stencil |
 be quiet png | stencil |
 be ready to defend yourself png | stencil |
 beware pickpockets png | stencil |
 bike thieves png | stencil |
 boring png | stencil |
 broken meter png | stencil |
 camera perverts png | stencil |
 camp here png | stencil |
 cars ticketed png | stencil |
 caveat emptor png | stencil |
 changing table png | stencil |
 cheap drinks png | stencil |
 check cashing png | stencil |
 civilized place png | stencil |
 contraception available png | stencil |
 cops active png | stencil |
 cops inactive png | stencil |
 danger png | stencil |
 dangerous homophobes png | stencil |
 dangerous neighborhood png | stencil |
 dishonest scalpers here png | stencil |
 dog png | stencil |
 food for work png | stencil |
 free doctor png | stencil |
 free out-of-date food png | stencil |
 free wifi png | stencil |
 get out fast png | stencil |
 go straight png | stencil |
 good cheap food png | stencil |
 good coffee png | stencil |
 good for a handout png | stencil |
 good to kids png | stencil |
 good veg-burger png | stencil |
 good water png | stencil |
 GPS is incorrect png | stencil |
 great dumpster png | stencil |
 habla espanol png | stencil |
 has showers png | stencil |
 help if sick png | stencil |
 here is the place png | stencil |
 hidden cameras png | stencil |
 high-fee ATM png | stencil |
 hold your tongue png | stencil |
 insecure wifi png | stencil |
 it’s fake png | stencil |
 just ignore him png | stencil |
 keep away png | stencil |
 keep going png | stencil |
 kind family png | stencil |
 lax oversight png | stencil |
 look down png | stencil |
 look up png | stencil |
 lots of outlets png | stencil |
 mean to children png | stencil |
 nice bathroom png | stencil |
 no bathrooms png | stencil |
 no changing table png | stencil |
 no fee ATM png | stencil |
 no outlets png | stencil |
 no pets png | stencil |
 no privacy png | stencil |
 open late png | stencil |
 over-priced png | stencil |
 over-rated png | stencil |
 owner gives to GOP png | stencil |
 owner has a gun png | stencil |
 perverts png | stencil |
 pissoir png | stencil |
 Plan B sold here png | stencil |
 prostitution sting png | stencil |
 scammers png | stencil |
 sleep in barn png | stencil |
 speed trap png | stencil |
 stay low png | stencil |
 strong phone signal png | stencil |
 talk religion get food png | stencil |
 tell a hard luck story here png | stencil |
 test market png | stencil |
 those aren’t real png | stencil |
 toll road png | stencil |
 tramp camp png | stencil |
 tramps arrested on sight png | stencil |
 turn left here png | stencil |
 turn right here png | stencil |
 unexpectedly good coffee png | stencil |
 unsafe area png | stencil |
 use gloves png | stencil |
 used frying oil available png | stencil |
 vegans beware png | stencil |
 well guarded png | stencil |
 will give to get rid of you png | stencil |
 work available png | stencil |
 worth saving png | stencil |
ACKNOWLEDGMENTS
QR_STENCILER was created by Golan Levin and Asa Foster III with support from the STUDIO for Creative Inquiry at Carnegie Mellon University. Thanks to Ben Fry, Andreas Schlegel, Marcus Beausang, Neil Brown & Judy Robertson for the terrific code they have made available online. A tip of the hat to Fred Trotter, Jovino, Ric Johnson, le Suedois, Patrick Donnelly, David J. Burden, Matt Jones and others who have gone down similar or related paths. Additional thanks to Andrea Boykowycz for creative input. Some of the QR_HOBO_CODES are adapted from or inspired by designs presented elsewhere by Fran DeLorenzo and Cockeyed.com. "QR code" is trademarked by Denso Wave, Inc.
KEYWORDS
Barcode, QR code, stencil, QR code stencil, graffiti, grafitti, graffiti research, graf technology, street art, culture jamming, tactical media, urban messaging, locative media, situated visualization, contextual computing, lasercut, laser cutter, digital fabrication, template, chalk signs, chalk, spray paint, spraypaint, fffffat lab, hobo culture, hobo signs, warchalking.
Earlier this week I presented “Infoviz Graffiti“, an adjustable lasercut stencil for the rapid deployment of pie-chart infographics. Shortly thereafter, Nicola Bozzi of Owni.eu, and Suzanne LaBarre of FastCompany.com, independently contacted me seeking interviews. Their questions were complementary so I have compiled my responses to them here.

How did you come up with the concept for this project?
Graffiti and information visualization have been long-term interests of mine. A few months ago, someone tweeted something about “graffiti infovis” and I immediately thought they had done something like this. When I followed their link, however, it just turned out to be some charts and maps depicting statistics about graffiti in their neighborhood. My accidental mental reversal (from “graffiti infovis” to “infovis graffiti”) stuck with me, got me thinking, and prompted this design.
Is this project meant for graffiti artists? Data viz designers? Both?
Your question implies that these are two separate occupations. My project hints at a world in which they are one and the same.
Is the political and emancipatory potential of information and communication today, in the age of the Internet and so-called Twitter revolutions, really bigger than the past, or is it all still about taking the streets?
Our information-environment interpenetrates the fabric of urban space. (Kevin Slavin has even convincingly argued that urban space now conforms itself to the needs of information flows.) But this relationship is not owed to some new feature of augmented-reality iPhone apps. It has always been this way; before the Internet, we had the agora, the pashkevil, the broadside. Information and urban space have always been coextensive, and impinge on each other; this is why e.g. the locus of the “Twitter revolution”, if there really is such a thing, is the Arab public square and not the PC in the family office. My stencil project simply corrects a technological bias in the ways we typically receive and consume visual displays of this information: a correction to the overprivileging of the digital screen and printed paper as the expected vehicles of information transmission and exchange. The pie-chart stencil addresses a paucity of tools for the high-speed reproduction of infographic messages in and around urban surfaces.
Do you think the pairing of infographics and graffiti is a natural marriage?
I do. Whether on the cover of USA Today or in the proceedings of the IEEE Conference on Visual Analytics, information graphics have become a dominant and readily-digestible mode of visual communication. People’s visual literacy for information graphics has never been greater. Of course, infographic conventions, like pie charts, exist for a reason: they’re possibly the most effective way to convey certain kinds of information, like percentages and ratios. On the flip side, street art and other vernacular modes of tactical visual communication are culturally voracious; they will engulf and adapt any techniques that suit their purposes. Technology transfer from the research lab to the street is inevitable when it’s politically imperative for those data to be communicated.
The greatest potential for infographic street art, it seems to me, has yet to be explored. It’s what I would call “locative infographics”, or “situated visualization” — which is what happens when the content of the visualization-graffiti is tightly coupled to the specific location at which it has been deployed. To take a concrete example, a spraypainted pie chart such as I have presented could convey the percentage of minority employees at some facility, or the percentage of a building’s energy obtained from clean sources. Other graphic devices, such as bar charts and histograms, could convey statistics about crime at a given location; this strategy would be most effective when deployed as a series of small multiples, e.g. allowing in-situ comparison of every address on a given street. (Others have presented situated visualizations using electronic means. For example, Chris Frauenberger has pointed out that some related work using locative electronic displays (e.g. The Pulse of Tidy Street) has been done by the Change Project. Augmented reality (AR) systems of this type also exist, such as SiteLens (2009, PDF), by Sean White of Columbia University.)
What can graffiti and infoviz learn from each other and how can they improve each other as media?
Earlier this week, someone generously tweeted that my project was “Banksy meets Tufte“. Although that’s high praise – both of these men are personal heroes – this remark definitely delineates the territory I’m seeking to explore. Certainly, it’s clear that Banksy and Tufte both share an aesthetic of graphic efficiency and a faith in the communicative power of simple messages. And of course, both street art and infographics depend on extreme visual economy to communicate effectively and memorably: graffiti must be quick to execute, charts must be easy to read. The key, I believe, is that both must also provoke. What makes my project significant, I hope, is that it reminds people that even a simple pie-chart can be used to communicate information that matters. It prompts us to question what information is worth visualizing, and why. Furthermore, by situating quantitative visual information in urban space, this project also compels us to commit to a confrontation with a specific audience in a specific locale.
It seems clear that the field of information visualization possesses tools and media which, suitably adapted, can bring new communicative capacities to street art. If street art has lessons for infographics, on the other hand, it is to remind us of the pressing need to explain the egregious problems of the world today, to the widest possible audience, and to prompt tactical thinking about how (and where) this be done most effectively. What data is essential to communicate to others? Can the insertion of that data, semi-permanently, into urban space, change people’s behavior? When is it worth risking arrest to ‘publish’ that information? These are the questions I hope my stencil project raises.
Why make the design available for free online?
The pie-chart stencil is free and online so that there’s the least possible barrier, whether financial or logistic, to people obtaining and using it! I’d like to point out some important context, though, which is that the design was released as a project of F.A.T. – the Free Art and Technology Lab – an artist collective, of which I am a member, “dedicated to enriching the public domain through the research and development of creative technologies and media.” The F.A.T. Lab works at the intersection of popular culture and open-source: grabbing people’s attention with, and giving them the tools to engage with, memes that matter. This approach is well-described by the F.A.T. Lab’s visual Venn Diagram motto which, come to think of it, is also an infographic.

As a media artist, what do you feel your personal duty is while intervening on the public imagination?
As an artist, I try to leave the world a more interesting place. I’m also an educator, so I care that people learn something new, and become empowered in some way.
In tandem with the release of Madeline Schwartzman’s new book, See Yourself Sensing: Redefining Human Perception, my interactive work EyeCode will appear this month in an exhibition at the Work Gallery, London.

I designed an adjustable lasercut stencil, suitable for the rapid deployment of pie-chart infographics.

The design comes with a set of re-arrangeable letters. Changing the message and percentage is straightforward.

The stencil has some noteworthy design features:
Here are the stencil designs (Illustrator CS4 .PDF format):

If you’d like to make one for yourself, you’ll need:

Additional documentation
I’ve written an article (“Some thoughts on infographic street art“), in response to interview questions by Nicola Bozzi and Suzanne LaBarre, explaining some of my thinking behind this project. Photographs for this project are available in high resolution in this Flickr photoset.
Press
“A provocative exhortation to get the substance of immediate information and infuse it with the boldness of political rage, hopefully defacing public properties and informing people at once.” — Nicola Bozzi
References for quoted statistics
Acknowledgements
This 4-hour Speed Project was supported by the STUDIO for Creative Inquiry at CMU. Thanks to Asa Foster III for production assistance, and to Nicola Bozzi and Suzanne LaBarre for their provocative interview questions.
License
Infoviz Graffiti Adustable Pie Chart Stencil by Golan Levin is licensed under a Creative Commons Attribution-NonCommercial-ShareAlike 3.0 Unported License.

Keywords
infoviz, infovis, infographics, information graphics, data visualization, information visualization, dataviz bombing, viz graffiti, grafitti, graffiti research, graf technology, street art, tactical media, contextual infosthetics, urban messaging, locative infographics, situated visualization, chart junk, pie chart stencil, adjustable pie chart, piechart, lasercut, laser cutter, digital fabrication, template, stencil, spray paint, spraypaint, speed project, fffffat lab.

